Story
With the event of Broad Street Cholera Outbreak in London in 1854, Dr. John Snow was the first person to bridge the link between the city infrastructure and the cholera outbreak. With the map he created, it showed the relationship among victims and city structures (streets, pumps, and landmarks) in order to provide compelling evidence for increasing the awareness of public health and improving hygiene facilities. Based on this real story, I used technologies to rebuild the map and also to implement an interactive visualization tool to analysts for interpreting data.
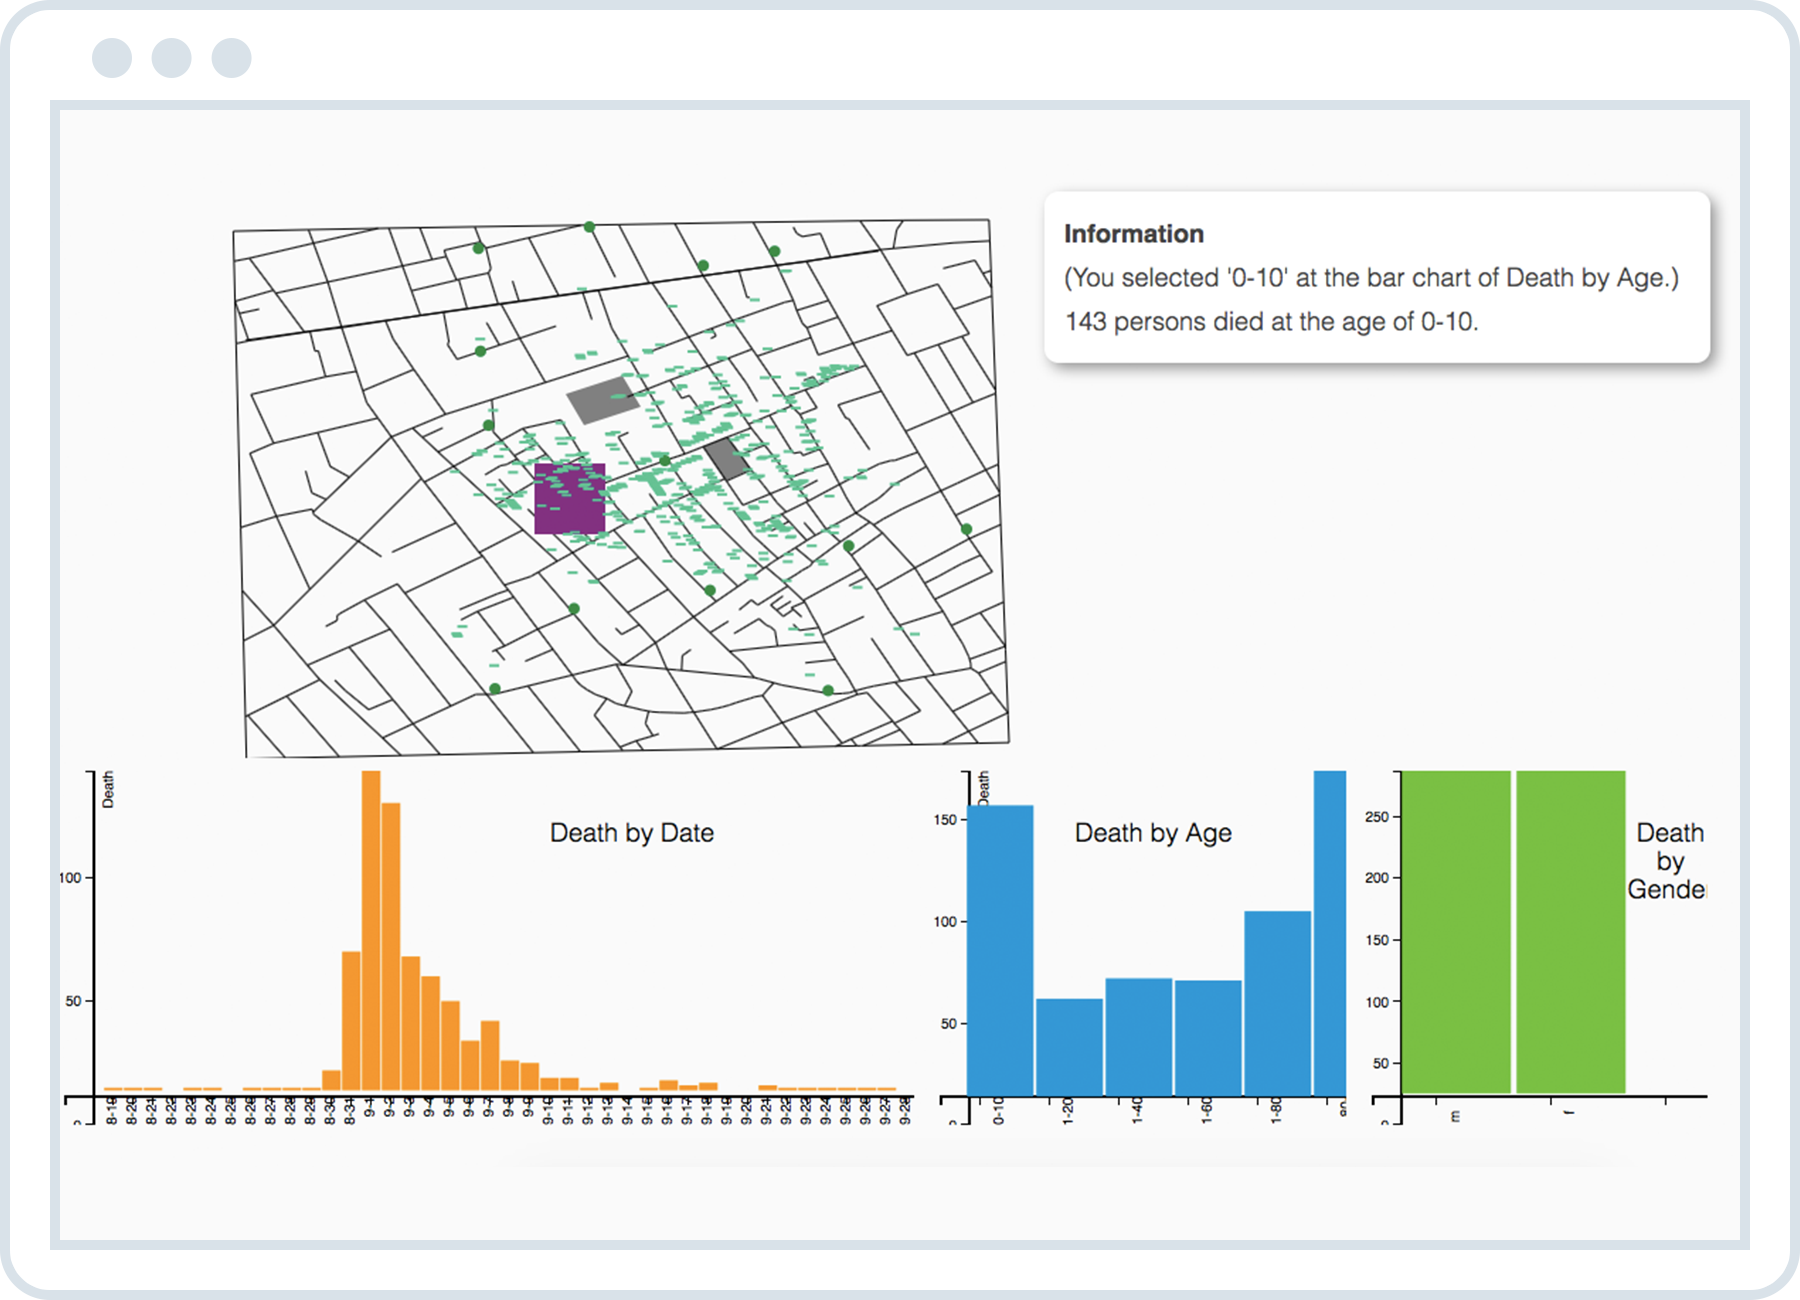
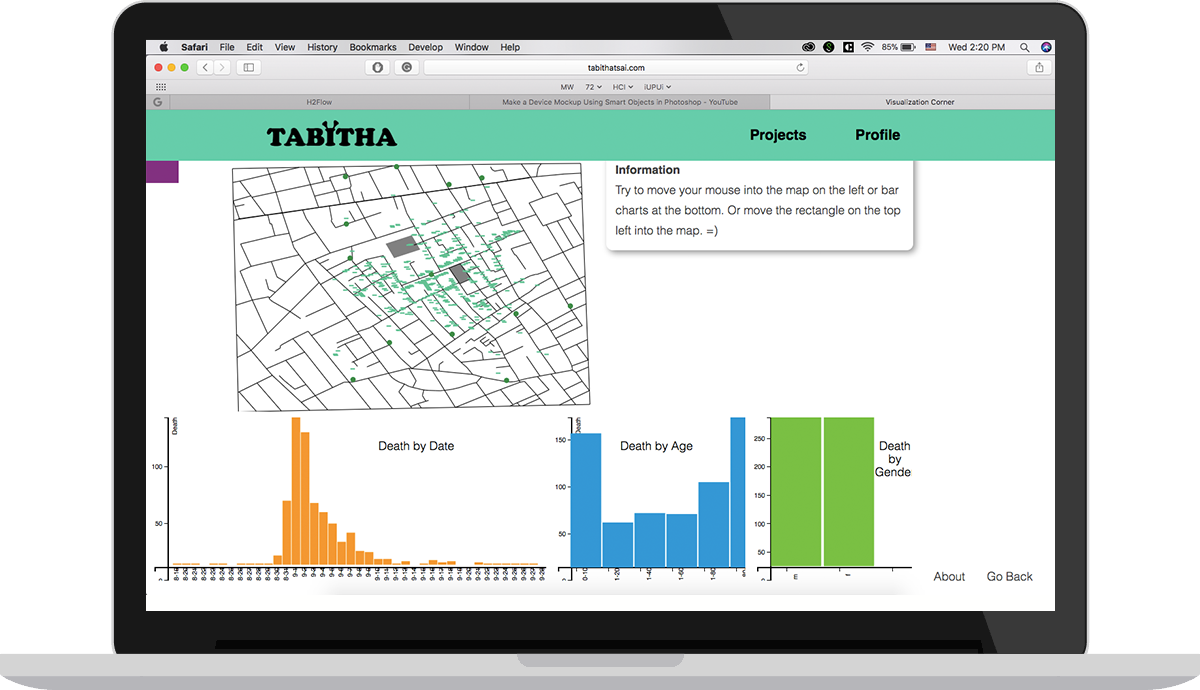
In this project, I used HTML, CSS, SVG, and worked with D3.js, accompanying with concepts shared in lectures, including, but not limited to, color perception and data patterns. This visualization tool (as seen the screen below) involved interactions between the map and charts, and information shows at the top right corner to give users more ideas about what status they are on through interacting with either the map or charts.
Video Introduction
This video shows three interactions:
- hovering over the map and it shows information of streets, pumps, landmarks, and victims
- hovering over the bar charts on the bottom and it correspondingly reflects on the map
- dragging a rectangle into a map, it shows how many people die in a specific area
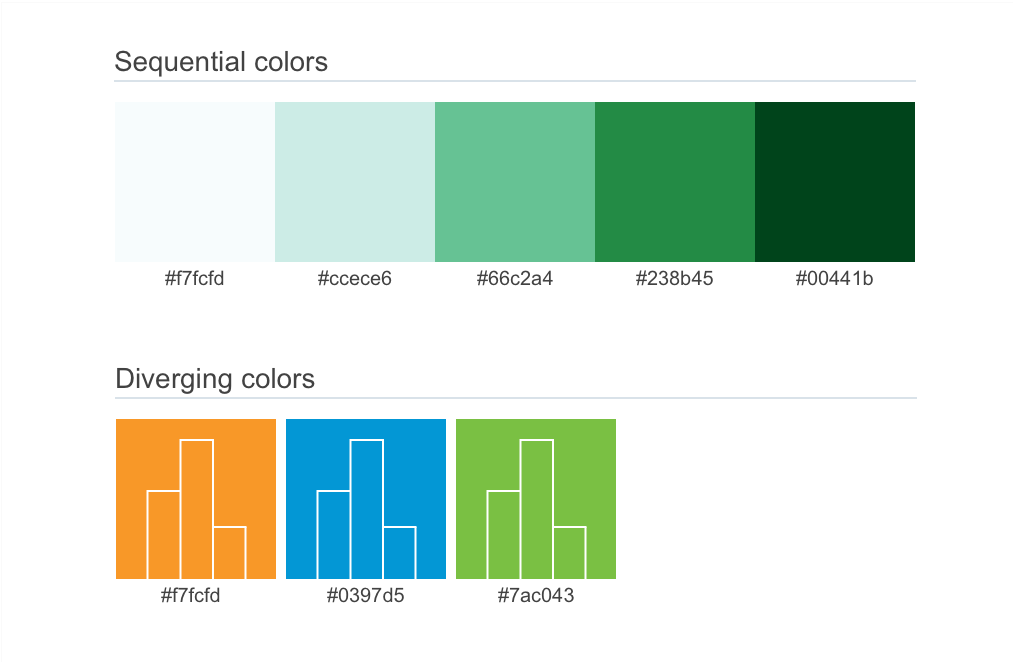
I used Color Brewer to select sequential colors (above) in order to utilize illumination for the normal mode and the highlight mode, which distinguished, for example, if elements are hovered over by a mouse. Because for different eye conditions, people render original colors into others. Thus, Illumination is a good channel to present objects.
Moreover, I removed some color-related words to avoid confusing users who have visual impairments. For example, initially I used "Please use the purple rectangle to…" on the information board and then removed the word purple because eye-impaired users, especially for tritanopia, see purple as a red-brown color.
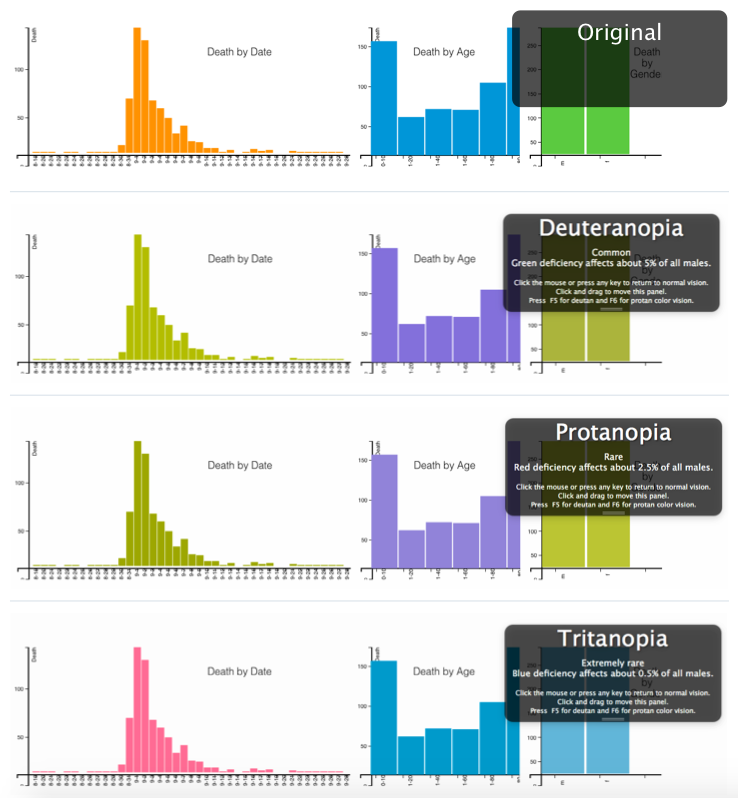
Additionally, for the three bar charts, I chose three colors (orange, blue, and green) and then viewed them with Color Oracle, and then rearranged the order of these three colors because orange and green look similar with the view of deuteranopia or protanopia. (as seen different views from color deficiency below)
Reflection
The most valuable part I got was seeing screens from different eye conditions and designing for various physical needs at the same time. This also encouraged me to learn more about accessibility because I want to design for all people, especially for those who are underserved.