Story
Chunghwa Telecom is the biggest telecommunication company in Taiwan, and has established U.S.A. branch since 2002 in San Jose, California, namely Chunghwa Telecom Global.
For the most cases, customers of Chunghwa Telecom Global are from enterprises who need telecommunication products or services, such as voice, VPN (Virtual Private Network), IP PBX (Internet Protocol Private Branch Exchange), IDC (Internet Data Center), and so on.
Problem
About their business process, it had been in paper-based more than ten years, yet the need of systematically processing through customer, quote, pricing, order, provisioning, and billing was necessary for retrieving and using data effectively and efficiently.
How They Work and What They Need
The target users I was designing for were across the organization: sales managers, product managers, pricing managers, finance managers, and engineers.
I conducted one-on-one contextual inquiry with each role to observe how they worked individually and collaboratively, what their goals were, and what tools they were using.
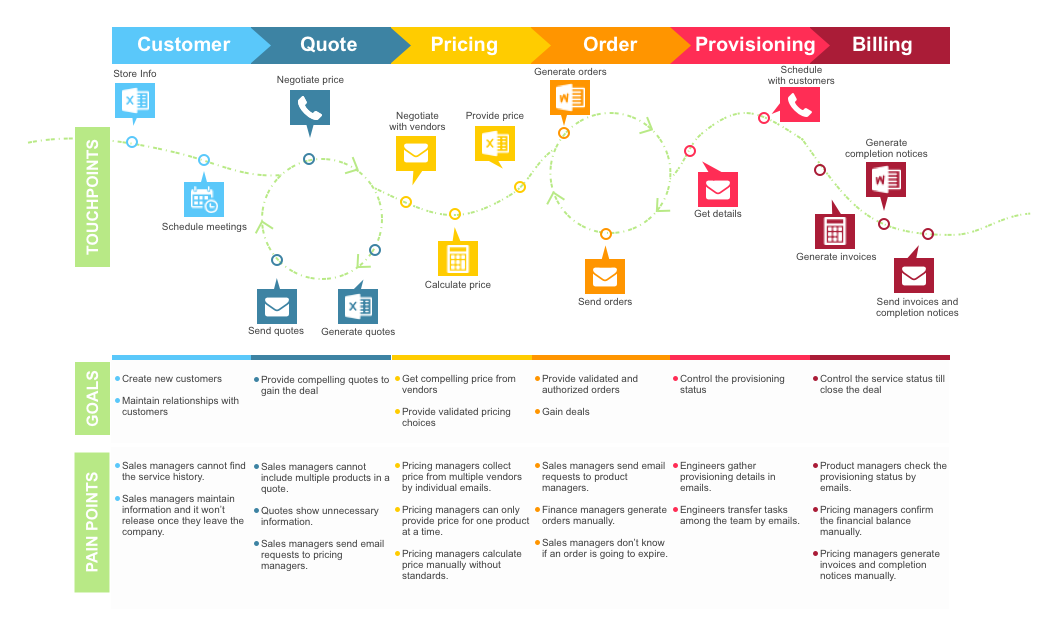
After observing and talking to users, I drew a journey map of the current workflow to see the process and pain points in a holistic view and to verify my assumptions.
Design Direction
The device employees were currently using was a laptop. I decided on creating a web-based collaboration platform, which took fewer cognitive loads from users, since they were used to web applications on completing work tasks.
On the other side, new features came up weekly in an agile development environment, and employees got the latest version of the platform without extra effort.
Information Architecture
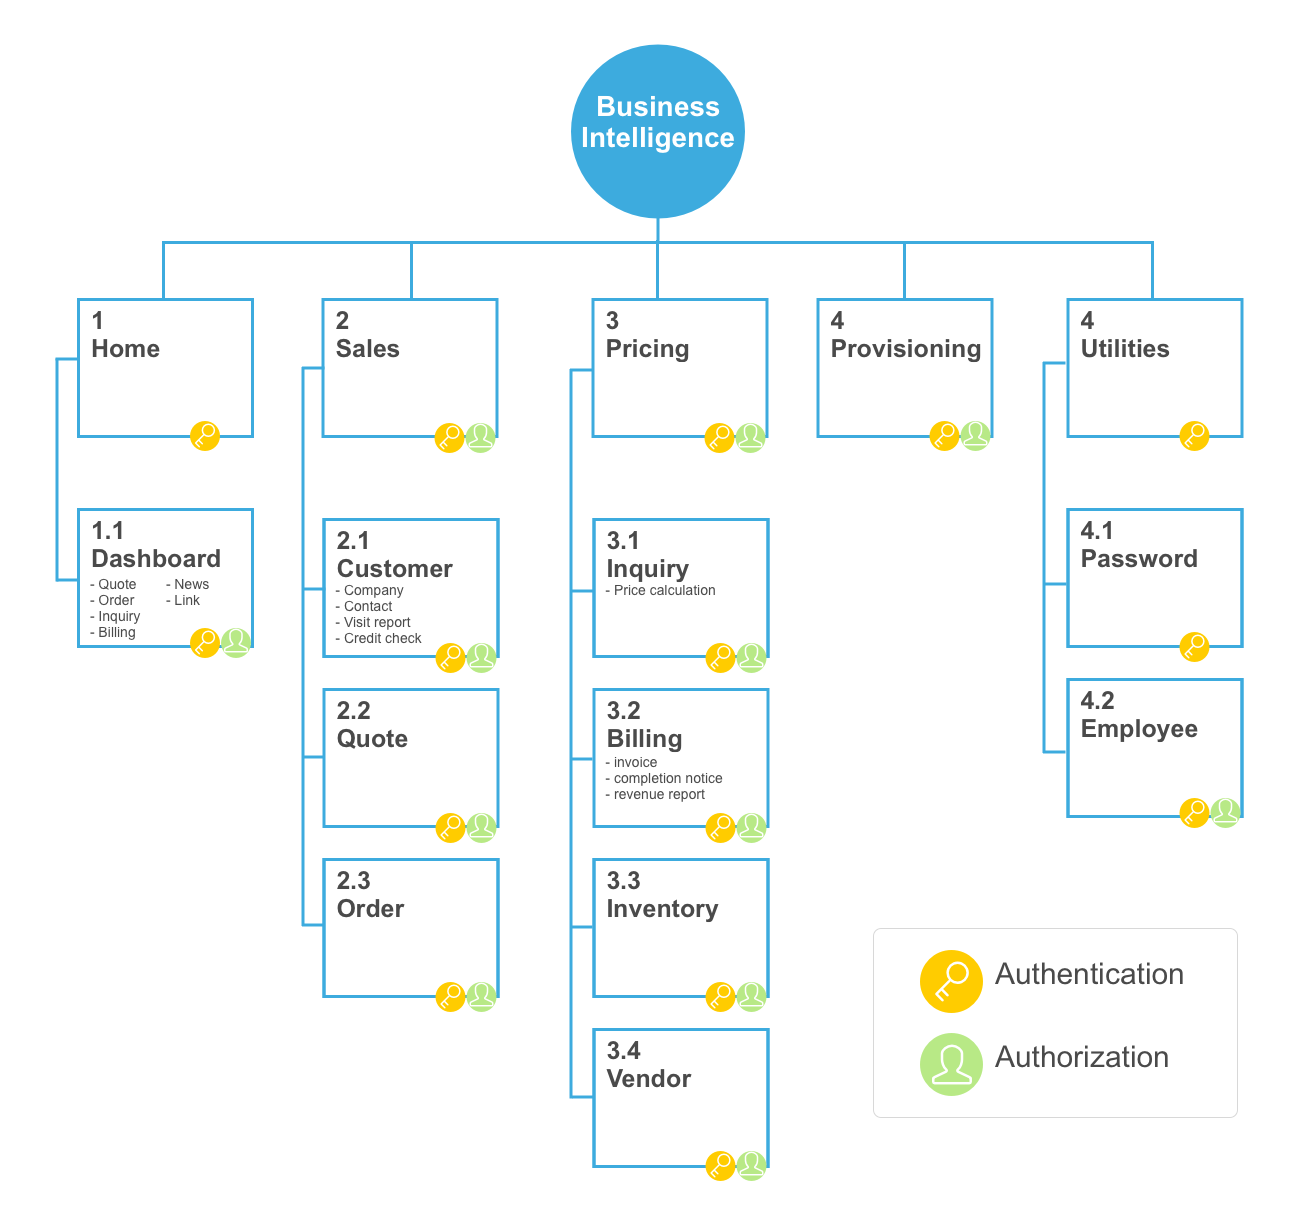
I designed the information architecture based on the teams’ functions by dividing the menu into dashboard, sales, pricing, and provisioning.
Dashboard was an overview of what users needed to pay attention to; Sales included management of customers, quotes and orders; Pricing had the price management before, during, and after deals; Provisioning had all the information engineers needed to install services on customer sites.
This platform was protected by VPN (Virtual Private Network) and the user’s account and password (Authentication); Depending on what roles employees were at, they had different interfaces with different functions, which they were in charge of (Authorization).
User Interface Design
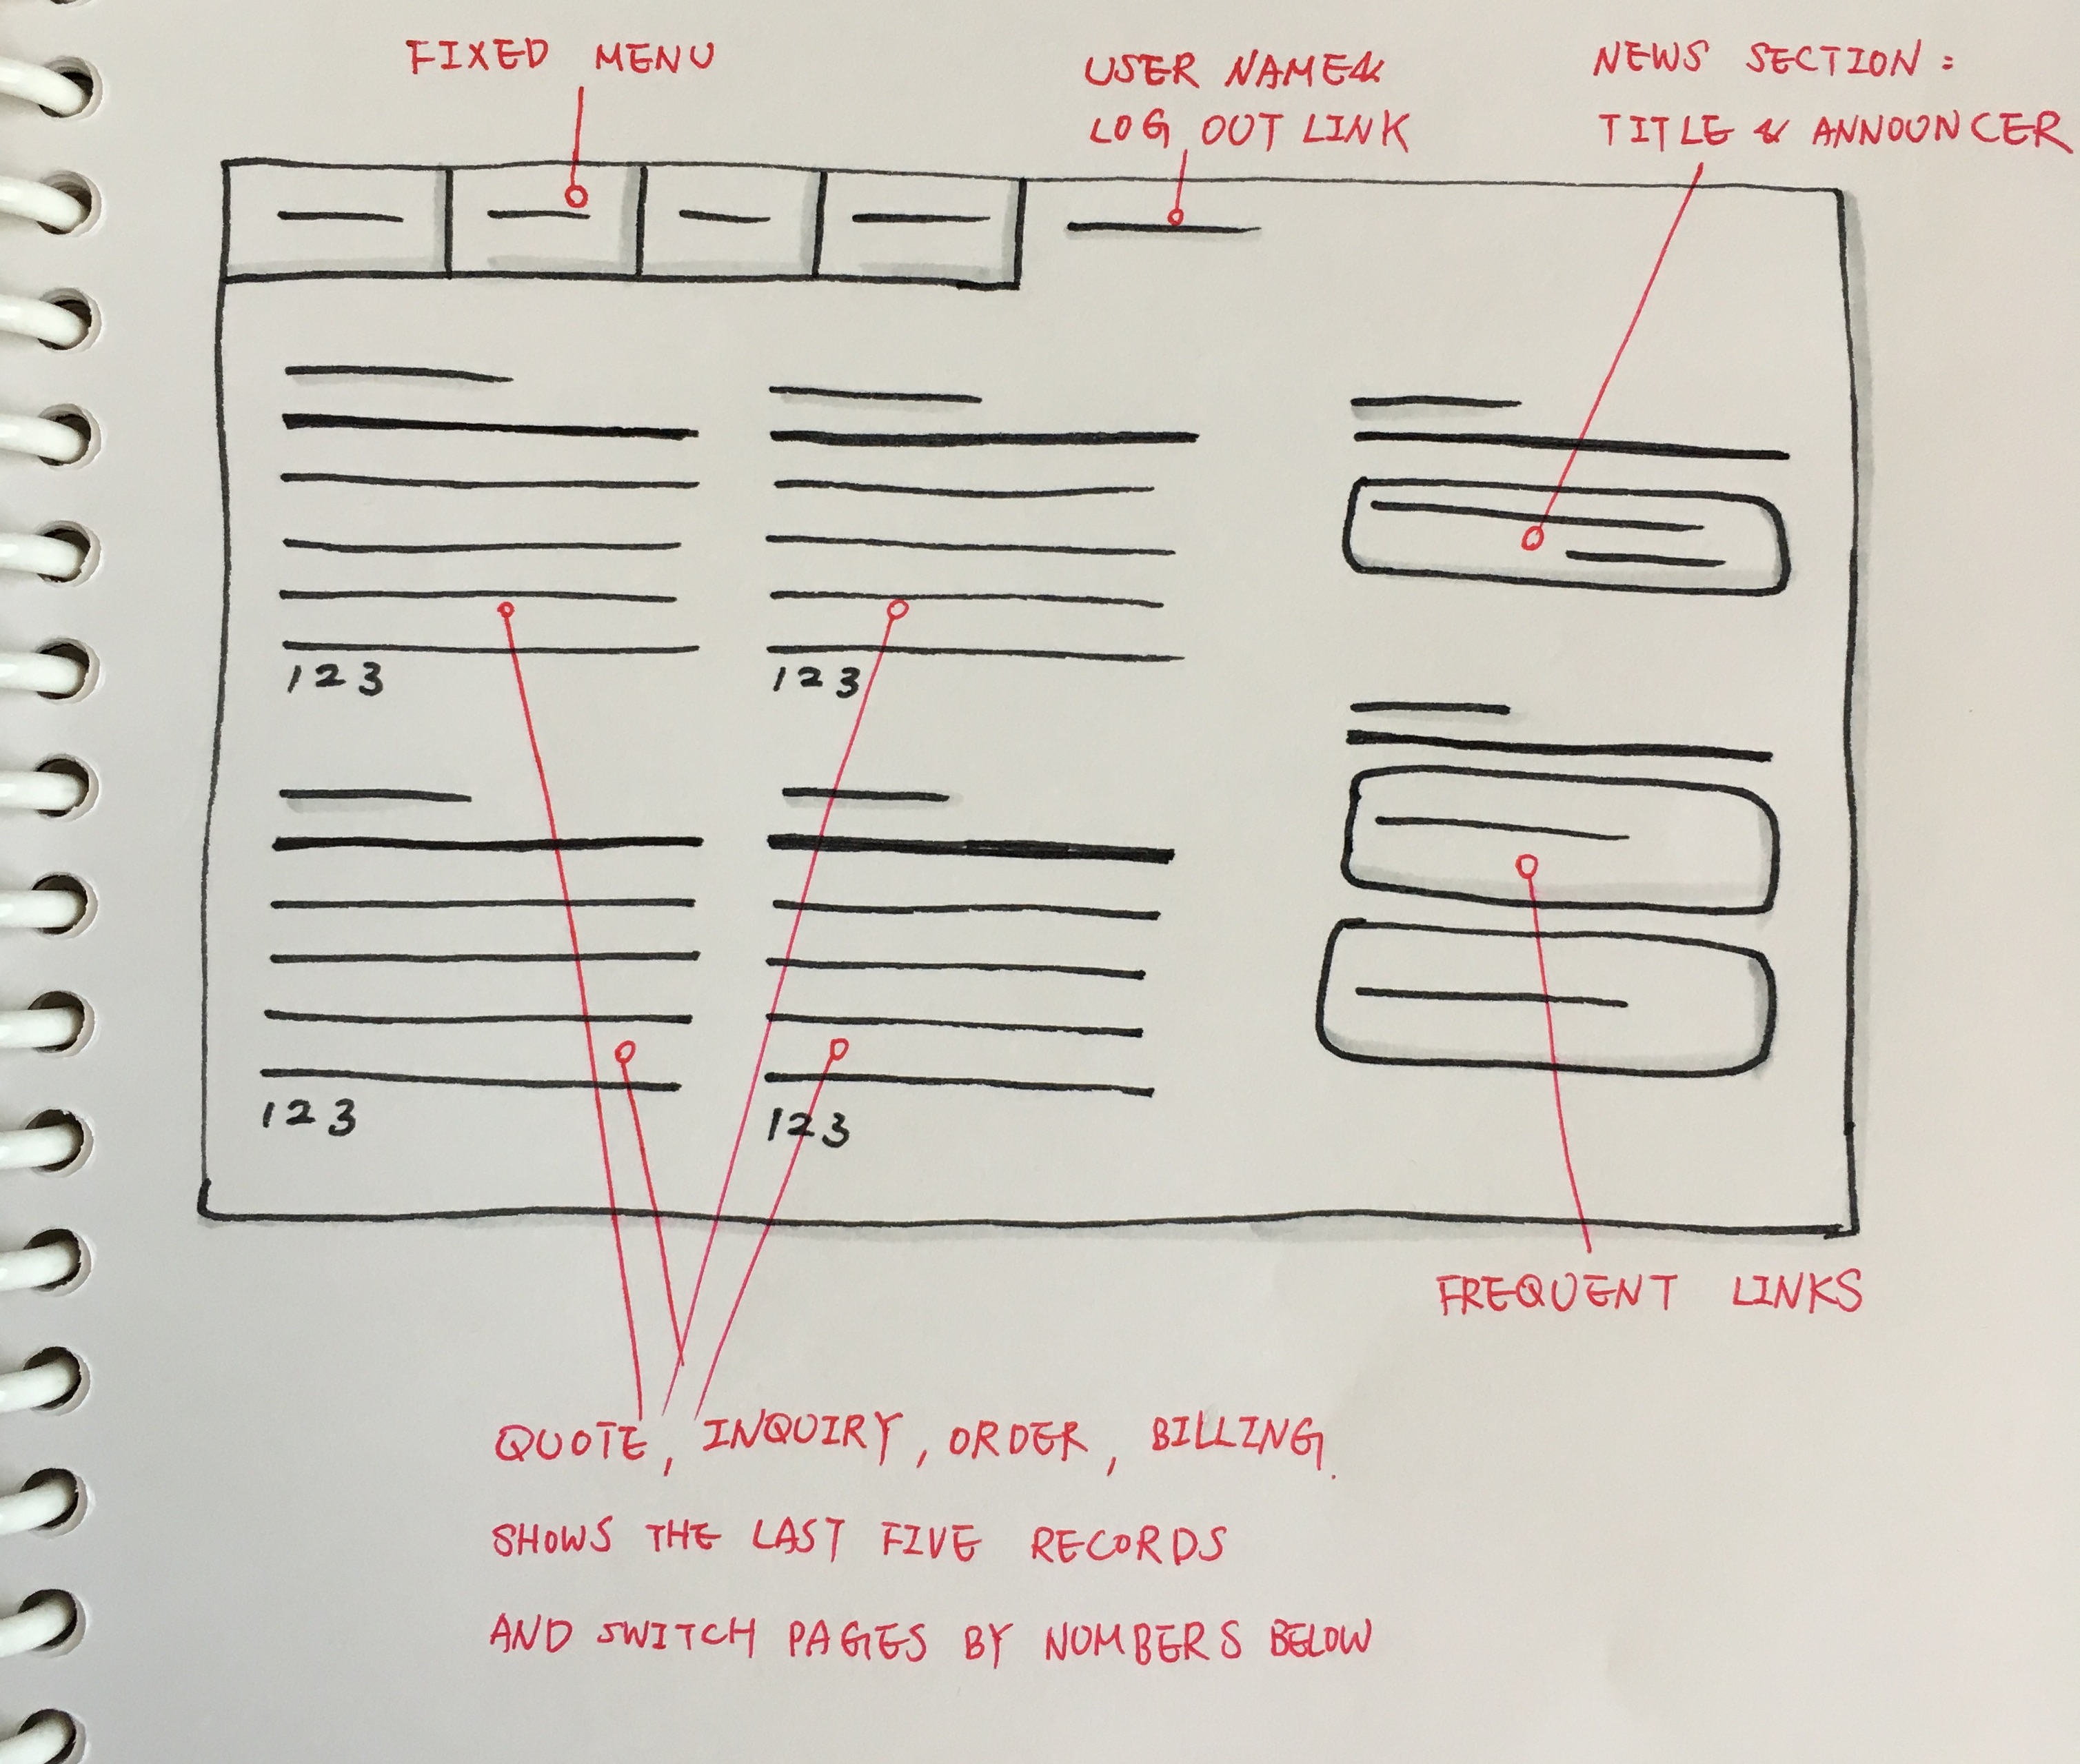
Dashboard
The content of the dashboard was different according to the user role. For example, sales managers had a quick view of contracts, sorted by the contract end day, which reminded them to visit customers for renewals.
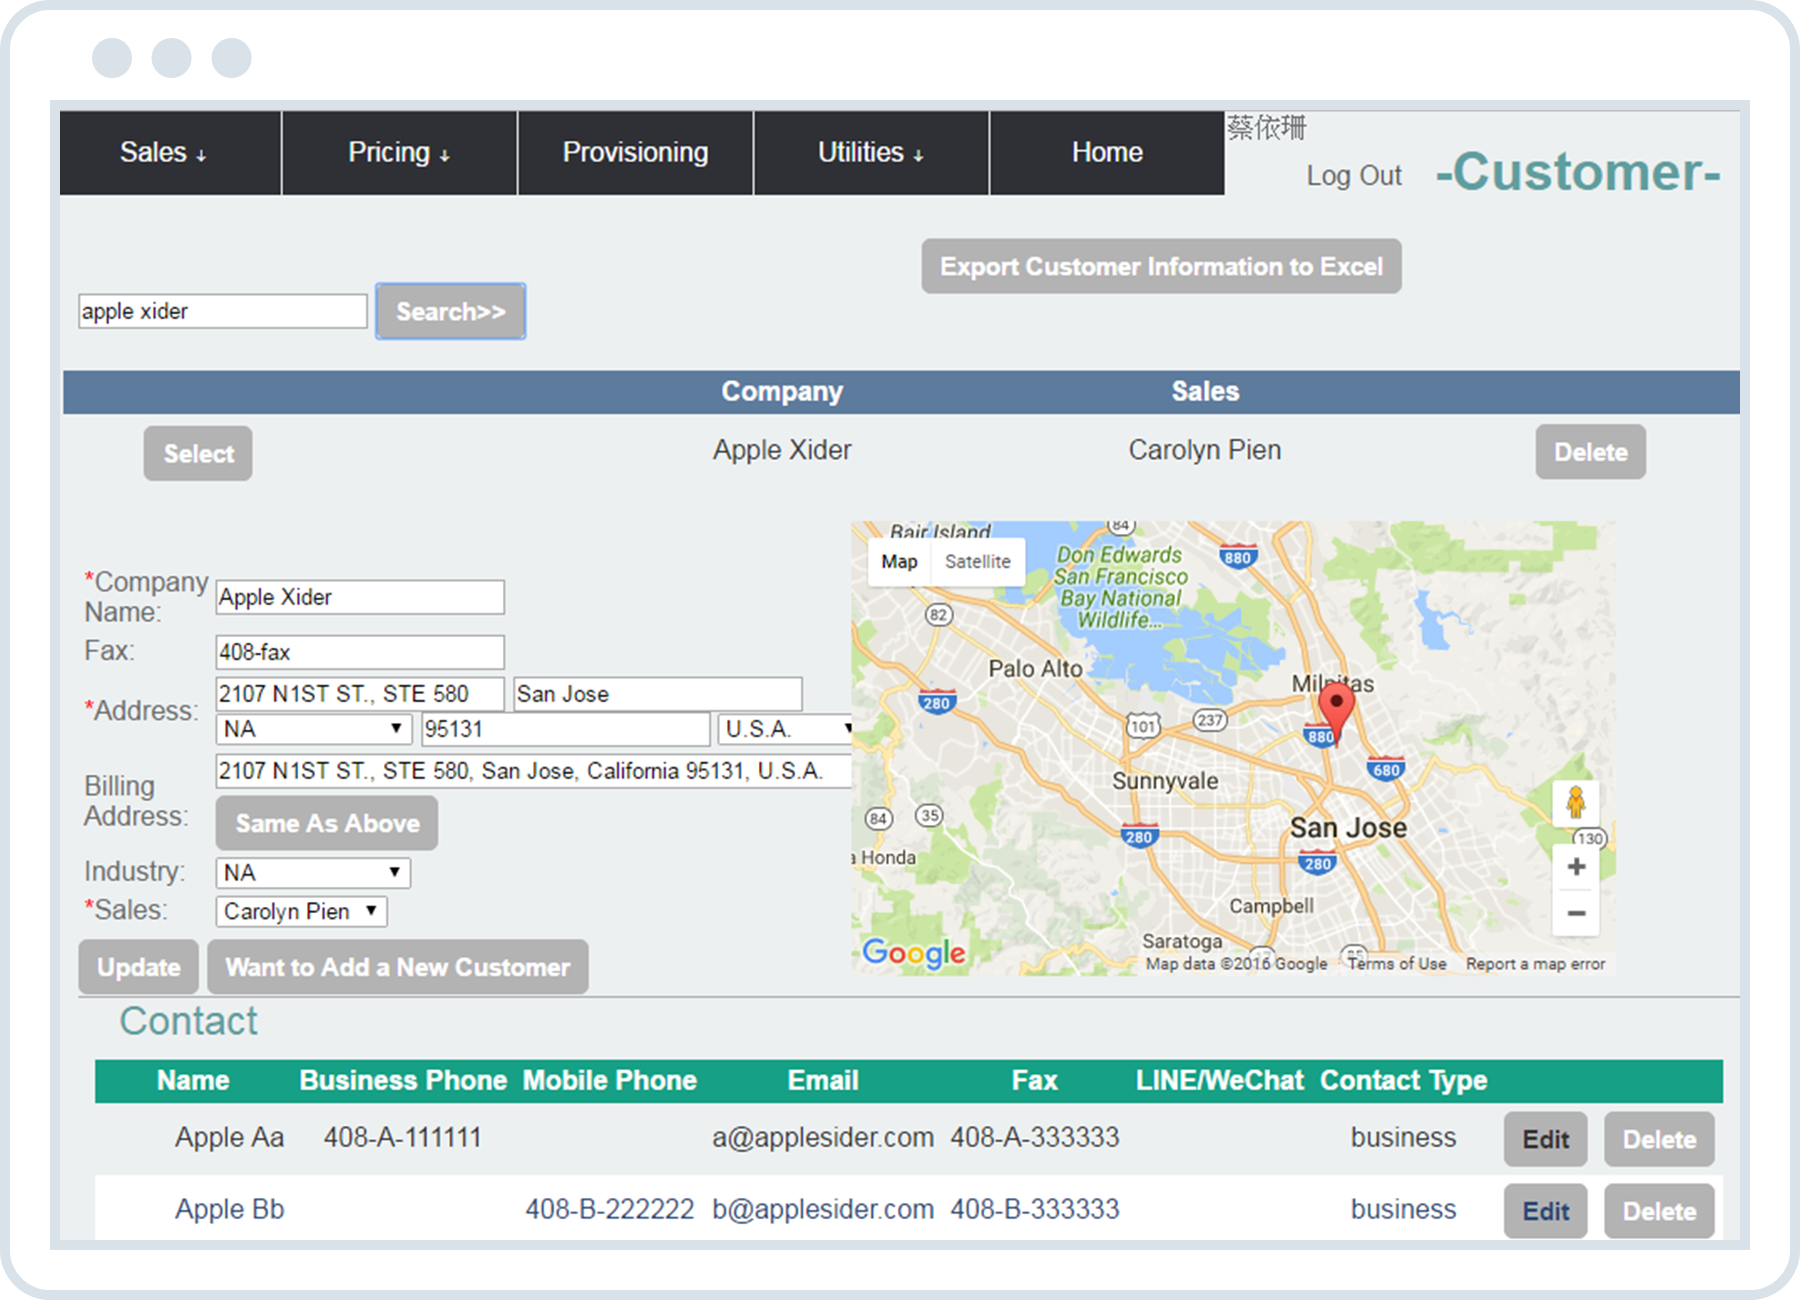
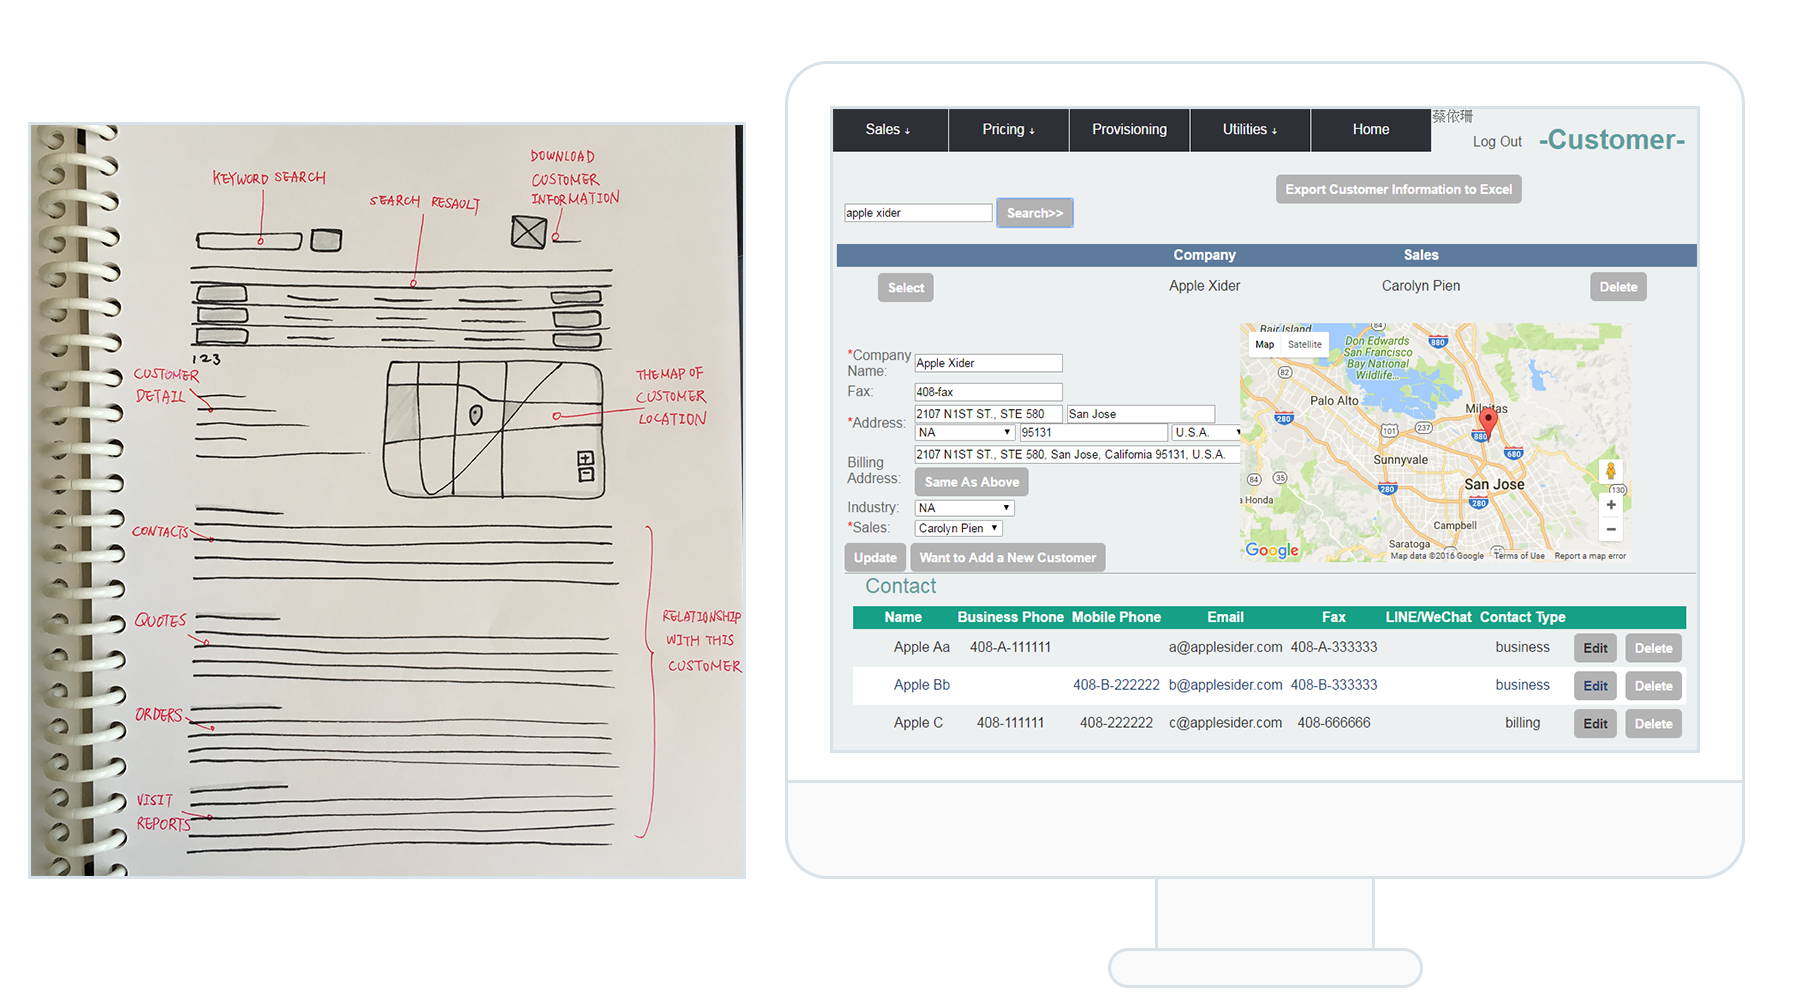
Customer Management
When designing interfaces of customer management, I presented two versions to our Sales VP (sales managers were unavailable to participate reviews that time). We chose the list view (as seen the sketch on the left below) because sales managers were used to working on excel sheets. In order to reduce their cognitive loads, I made the interfaces excel-ish and attached the map of customer sites to help them plan for visiting.
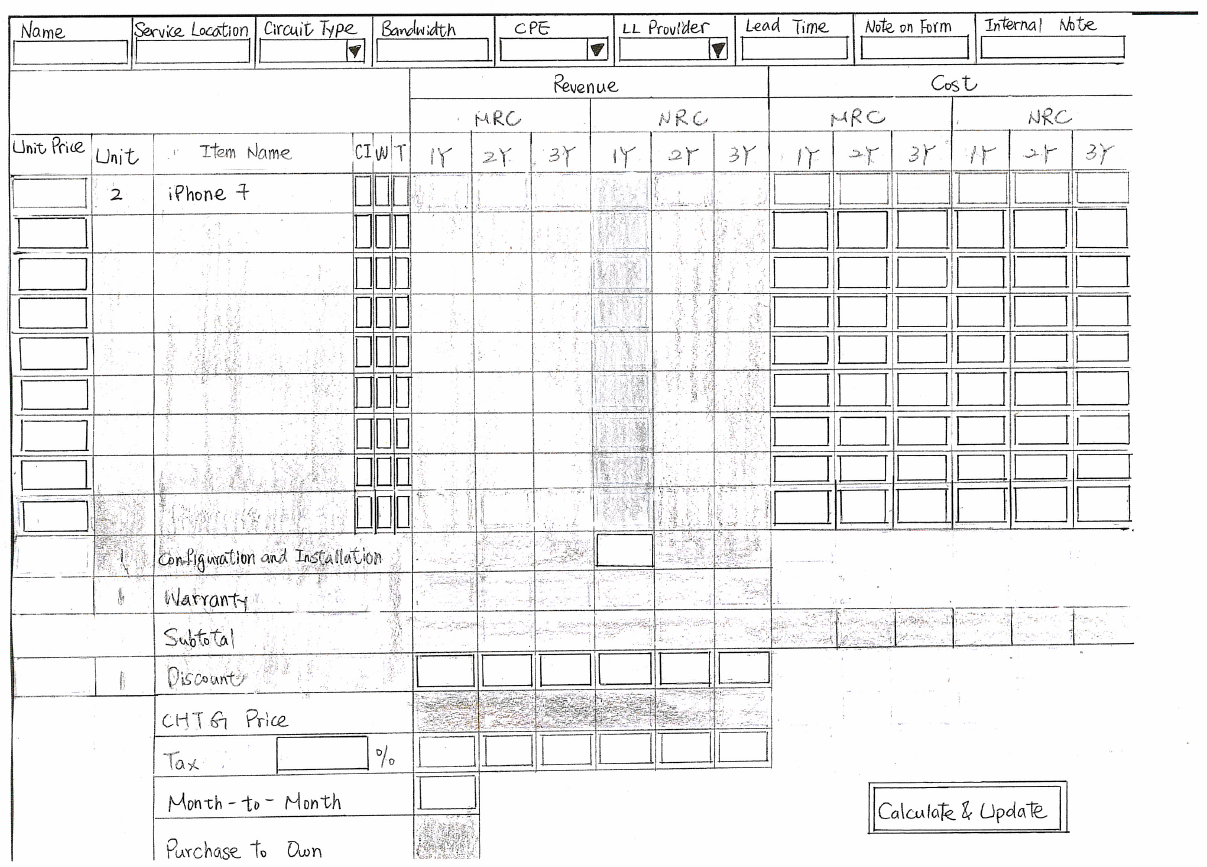
Pricing
Pricing was one of the most critical features. I paid more attention to in order to avoid anything went wrong. Since our pricing managers had different ways to calculate the price, going through multiple design and testing iterations was necessary for standardizing the price calculation.
The paper prototype was a good tool, which I could make changes during the functional and usability testing with pricing managers.
Result
This platform helps teams operate faster and build better relationships with customers. I made this platform flexible in case of they serve customers new services or products in the future. It is still working well, even I've left this company for two years (since July 2017).
Reflection
It was a great opportunity to interact with users from various departments and to understand their languages, goals and needs. The most valuable thing I learned was that listening to users and fully understanding what they meant was a key to design and develop a tool, which made their work easier.
It feels really good to help people through design and I’ll keep doing this.